Trading is as much about timing as it is about understanding market patterns, and the double top pattern is a prime example of this. Imagine spotting a stock or currency that reaches a high price twice, only to drop like a stone afterward. Thats the essence of the double topa sign that what once seemed unstoppable is about to turn south.
If youve ever wondered how experienced traders catch these turns, the double top pattern is their roadmap. In this article, well break down this simple yet powerful pattern, revealing why its a favorite for predicting bearish reversals and how you can use it to your advantage.
What Is a Double Top Pattern?
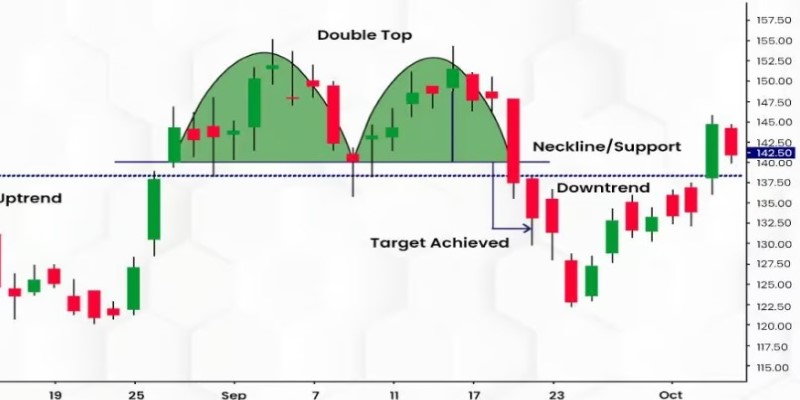
A double top pattern is a bearish reversal pattern that occurs at the end of an uptrend. It is characterized by two distinct peaks, roughly equal in height, with a trough or "valley" separating them. This pattern is often interpreted as a sign that the upward momentum is fading, and a trend reversal might be imminent.
In simpler terms, after a price surge, the asset hits a resistance level (the first peak), retraces, and then makes another unsuccessful attempt to breach the same resistance level (the second peak). This failure to make new highs signals that the market could be transitioning from bullish to bearish.
Anatomy of the Double Top Pattern

To fully understand how a double top pattern works, its important to break down its key components:
The First Peak: As the price rises in an uptrend, it eventually hits a resistance level where it struggles to go higher. This creates the first peak, which marks a temporary halt in the prices upward movement.
The Trough (Valley): After hitting the first peak, the price declines to form a trough. This decline is usually seen as a brief period of consolidation, but it serves to indicate that selling pressure is beginning to build.
The Second Peak: The price makes a second attempt to break the previous resistance level, but it fails to do so, creating the second peak. The inability to push higher is a signal of weakening momentum.
The Neckline: The trough between the two peaks forms the "neckline." This level represents a key support area, and when the price breaks below this line, it confirms the pattern and signals a bearish reversal.
Confirmation: Traders typically wait for the price to break below the neckline with increased volume, confirming the double top pattern. At this point, most traders would enter a short position, anticipating further downward movement.
How Does the Double Top Pattern Works?
The double top pattern functions as a bearish reversal indicator, meaning that it signals the end of an uptrend and the beginning of a potential downtrend. The logic behind this pattern is simple: after reaching a high, the asset attempts to retest that level but fails, indicating that the buying power driving the uptrend has weakened.
A key element of trading the double top pattern is volume. As the price approaches the second peak, trading volume typically declines, which is a warning sign that fewer traders are willing to buy at the higher price. When the price finally breaks below the neckline, a surge in volume often accompanies the move, confirming the bearish trend reversal.
Pros and Cons of the Double Top Trading Pattern
The Double Top pattern is a popular technical analysis tool used to signal a potential bearish market reversal. However, like any trading tool, it comes with its own set of advantages and disadvantages. Here's a closer look at the pros and cons of using the double top pattern in trading:
Pros of the Double Top Pattern
Strong Reversal Signal: The Double Top pattern is highly reliable in signaling the end of an uptrend. When confirmed by a break below the neckline, it suggests that the market is shifting from bullish to bearish. This reversal can help traders make informed decisions about entering short positions.
Easy to Identify: The pattern is visually distinct and straightforward to spot, making it accessible even to novice traders. The "M" shape, consisting of two peaks separated by a trough, is easy to recognize on price charts.
Clear Entry and Exit Points: The Double Top pattern provides well-defined entry and exit points. Traders can enter a trade after the price breaks the neckline, set stop-loss orders above the second peak, and project a profit target based on the height of the pattern.

Cons of the Double Top Pattern
Risk of False Signals: The pattern can sometimes generate false signals. For example, the price may fail to break the neckline or even rebound after testing it. In such cases, traders who entered short positions prematurely may face losses.
Requires Patience for Confirmation: Traders who follow the Double Top pattern must wait for the price to break the neckline before confirming the pattern. This cautious approach can result in delayed entries, sometimes missing a portion of the downward movement.
Misinterpretation Risk: If the peaks are too close together or the volume doesnt align with expectations, traders may mistakenly interpret the pattern and enter trades based on inaccurate signals. This can lead to unnecessary losses if the market doesnt reverse as expected.
Conclusion: Why the Double Top Pattern Matters
The double top pattern is a powerful tool for traders who want to identify potential reversals in uptrends. When used correctly, it provides a clear signal that the market is losing momentum and may be heading downward.
However, like any trading strategy, the double top pattern is not foolproof, and traders should always use other indicators and risk management tools to validate their trades. Adding the double top pattern into your trading approach can help you make more informed decisions, whether you're trading stocks, forex, or other financial instruments.


